Cars to Avoid
UK vehicles with the highest MOT failure rates
Avoid models with frequent issues and high repair costs, based on millions of MOT tests analyzed by Dave.

Showing results for Ford
Clear allFord Cars to Avoid
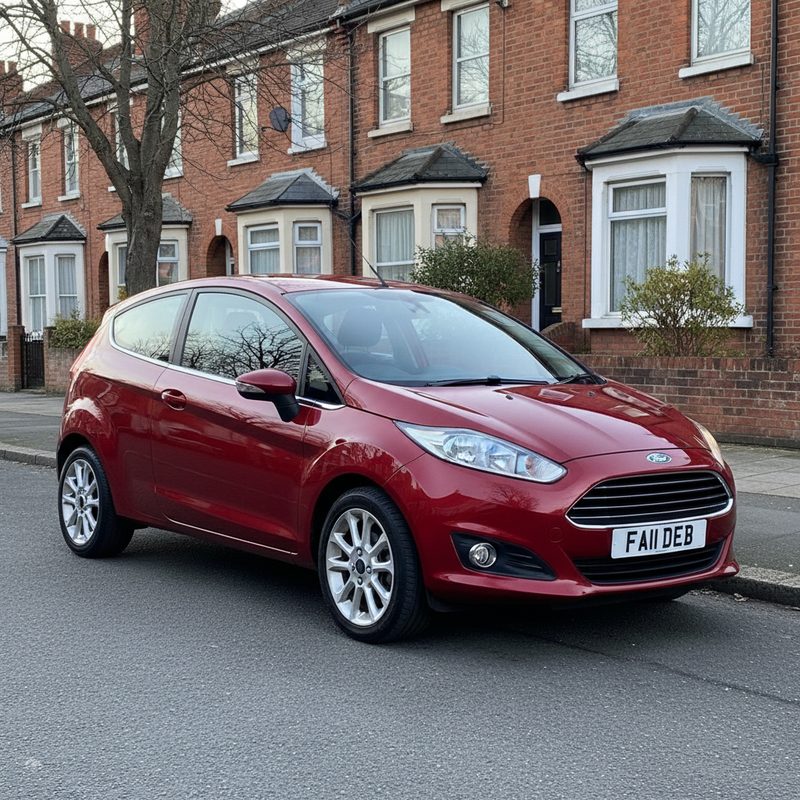
Ford FIESTA (2008–2014)
2008–2014
Key Issues
- Tyres defects
- Tyres defects
- Tyres defects
Average Repair Cost
£150 – £900
Estimated £150 – £900
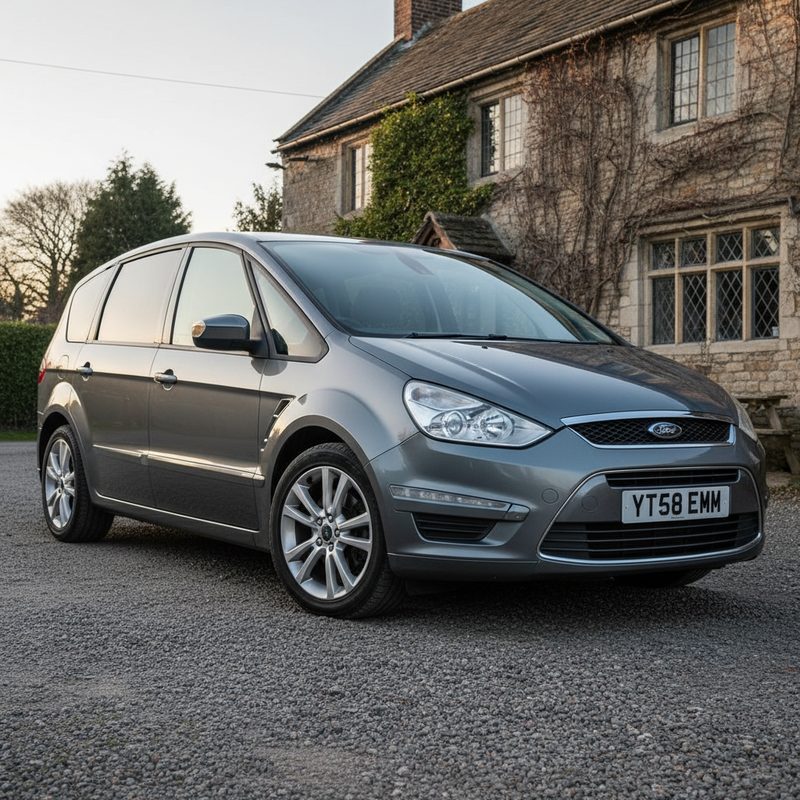
Ford S-MAX (2008–2008)
2008–2008
Key Issues
- Tyres defects
- Brakes defects
- Suspension defects
Average Repair Cost
£250 – £1,550
Estimated £250 – £1,550
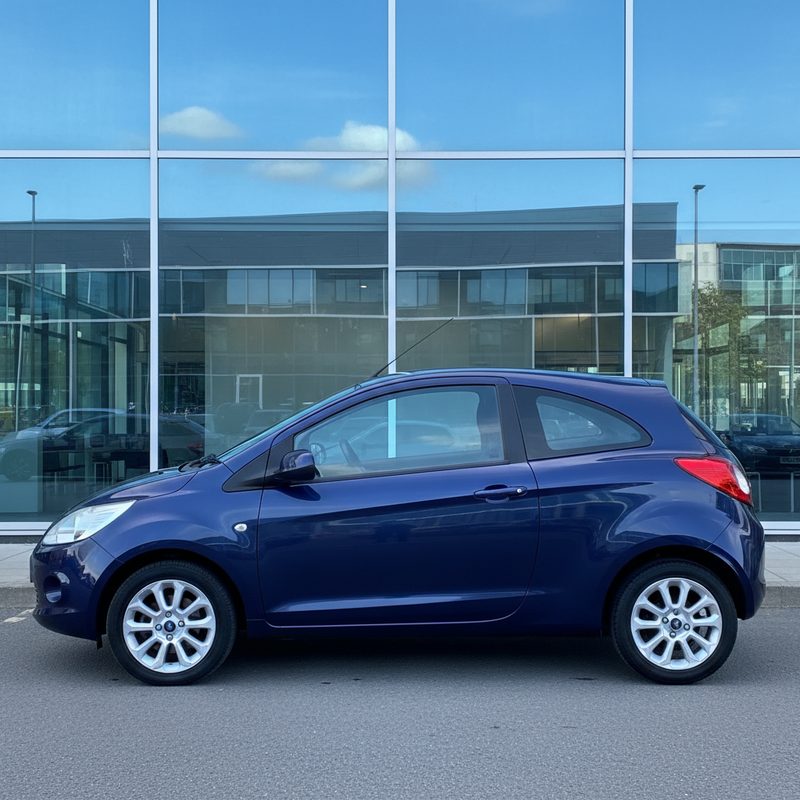
Ford KA (2010–2010)
2010–2010
Key Issues
- Brakes defects
- Tyres defects
- Suspension defects
Average Repair Cost
£250 – £1,550
Estimated £250 – £1,550
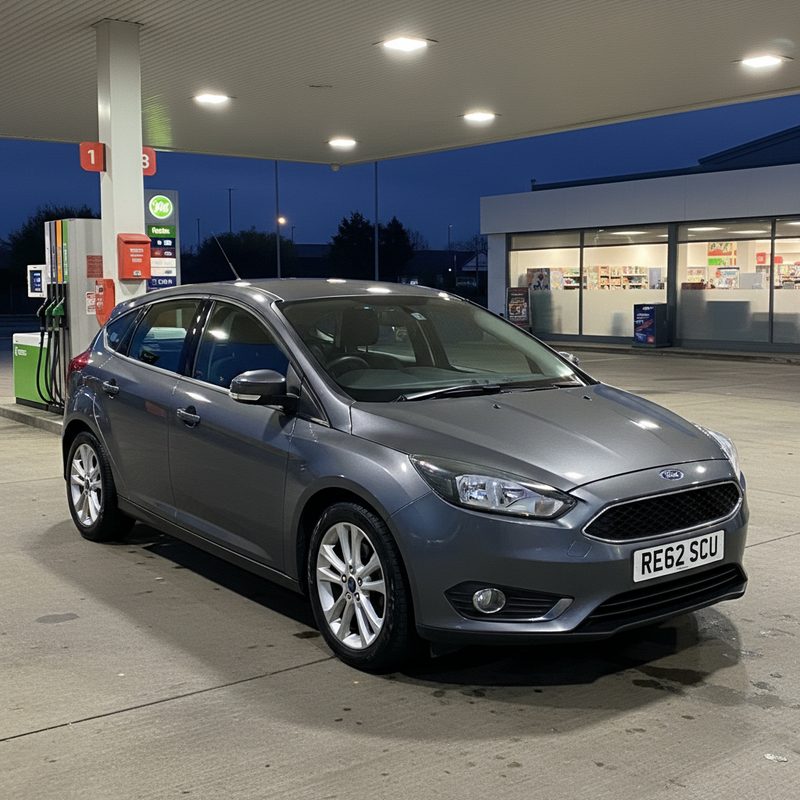
Ford FOCUS (2010–2013)
2010–2013
Key Issues
- Tyres defects
- Suspension defects
- Tyres defects
Average Repair Cost
£220 – £1,400
Estimated £220 – £1,400
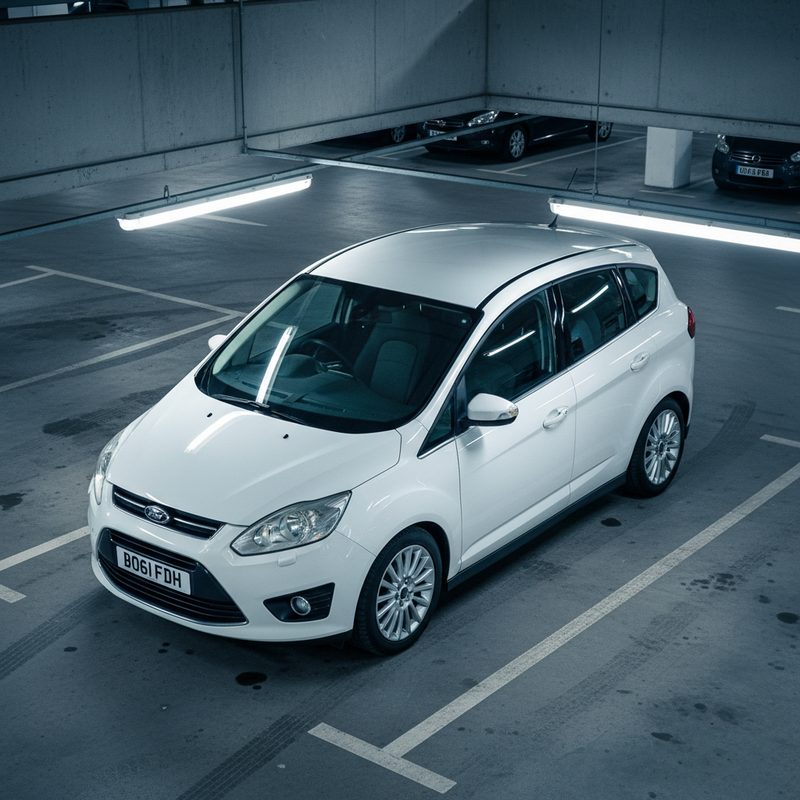
Ford C-MAX (2011–2011)
2011–2011
Key Issues
- Tyres defects
- Brakes defects
- Tyres defects
Average Repair Cost
£180 – £1,050
Estimated £180 – £1,050
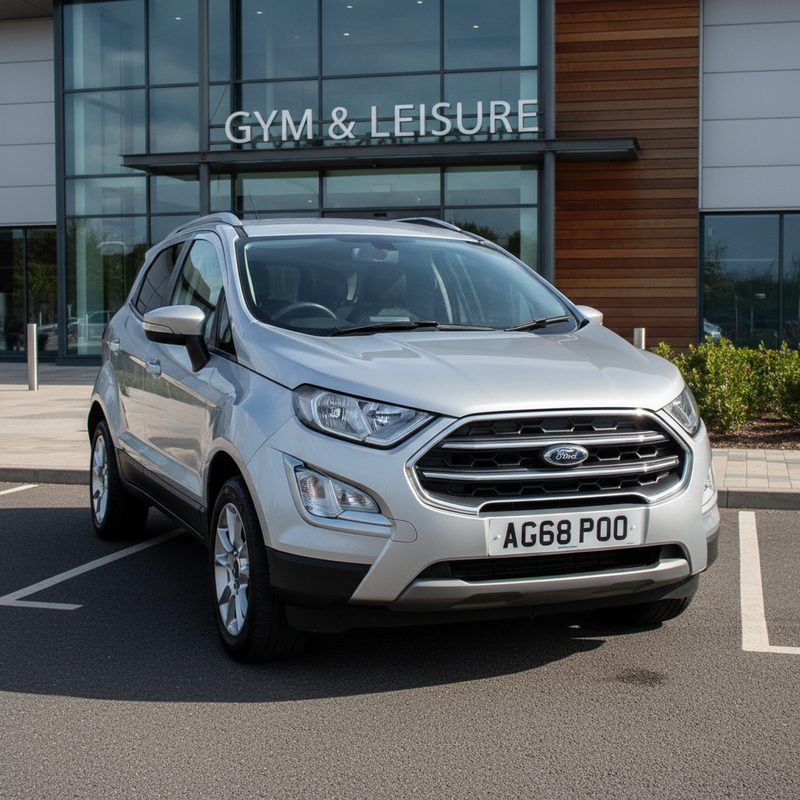
Ford ECOSPORT (2016–2016)
2016–2016
Key Issues
- Tyres defects
- Brakes defects
- Suspension defects
Average Repair Cost
£250 – £1,550
Estimated £250 – £1,550
Failure Rate By Mileage
Mileage breakdown data available after MOT bulk import
Run php artisan mot:bulk-import
Check if a car is risky
Most Avoided Cars (2026)
How This Works
- Millions of MOT records analyzed
- Failure frequency weighted by age & mileage bands
- Compared against national averages from DVSA bulk data
- AI-enhanced narratives layered on real statistics
- Repair cost estimates sourced from UK garages
FAQs
Dave's Tip
Before considering any used car purchase, check its complete MOT history before buying. It could save you thousands.
🔧 Worst for Corrosion (6)
View all 6Ford KA
2010–2010
The Ford KA (2010-2010) has a high corrosion failure rate, making it a poor choice for buyers.
Typical cost: £250 – £1,550
Ford FOCUS
2008–2012
The Ford FOCUS (2008-2012) has a high MOT failure rate, particularly for corrosion-related issues.
Typical cost: £220 – £1,400
Ford C-MAX
2011–2011
The Ford C-MAX (2011-2011) has a high MOT failure rate, particularly for corrosion issues.
Typical cost: £180 – £1,050
Ford FIESTA
2008–2008
The Ford FIESTA (2008-2008) has a concerning 28.1% MOT failure rate, particularly for corrosion.
Typical cost: £150 – £900
Ford ECOSPORT
2016–2016
The Ford ECOSPORT (2016-2016) has a concerning 21% MOT failure rate, particularly for corrosion.
Typical cost: £250 – £1,550
About this data
This information is compiled from DVSA published MOT failure statistics, manufacturer recalls and Technical Service Bulletins (TSBs), and widely documented engineering defects. Individual vehicles may differ — always check a specific car's history before buying.
Check a specific car with DaveLooking for Reliable Choices?
Not every car is a risk. Browse our in-depth vehicle insights to find models worth buying.